I woke up one day and realized that I need to be more responsible financially. I wanted to start by tracking my expenses.
Tools #
I started by sticking to my usual tools, Markor on Android, Synthing and a CSV file expenses.csv.
I can say it works really well. Entering expenses is quick on mobile, maybe because I’m used to working with CSV. The UX is mostly just the keyboard and the comma character.
You’re probably asking, why not use any other financial application out there?
Simple, I want to keep my tools simple. My current “ecosystem” already works pretty well. Adding another application probably means that it will not fit right in with the tools I use, which means I’ll have to adjust things again.
Why not a spreadsheet?
I’ve tried that, and on mobile, the UX is too clunky. I need to be able to add items while I’m out buying stuff.
And most importantly, I just like creating my own applications.
Structure of the CSV File #
The file is structured like this:
DATE, ITEM, QUANTITY, PRICE, TOTAL, CATEGORY
If DATE is empty in a row, the date of the previous row will be used. This makes it easier to add rows when I’m outside.
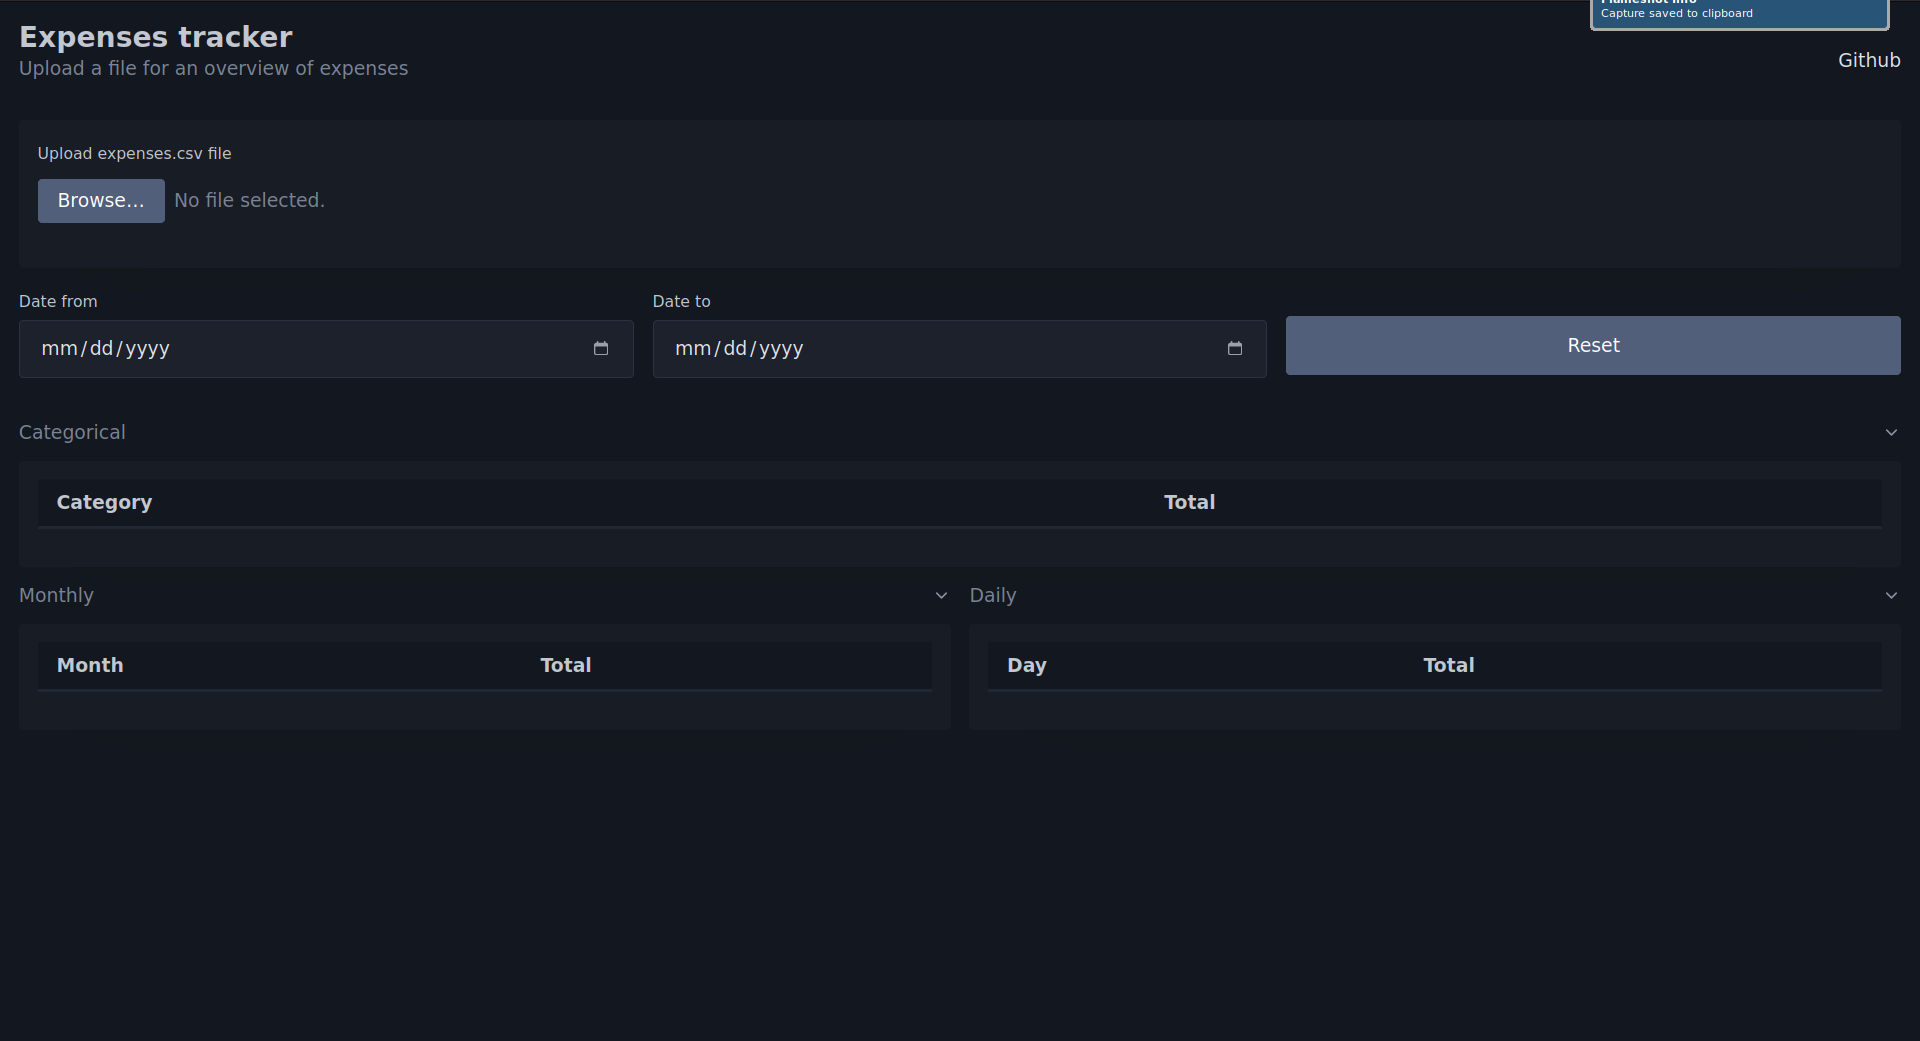
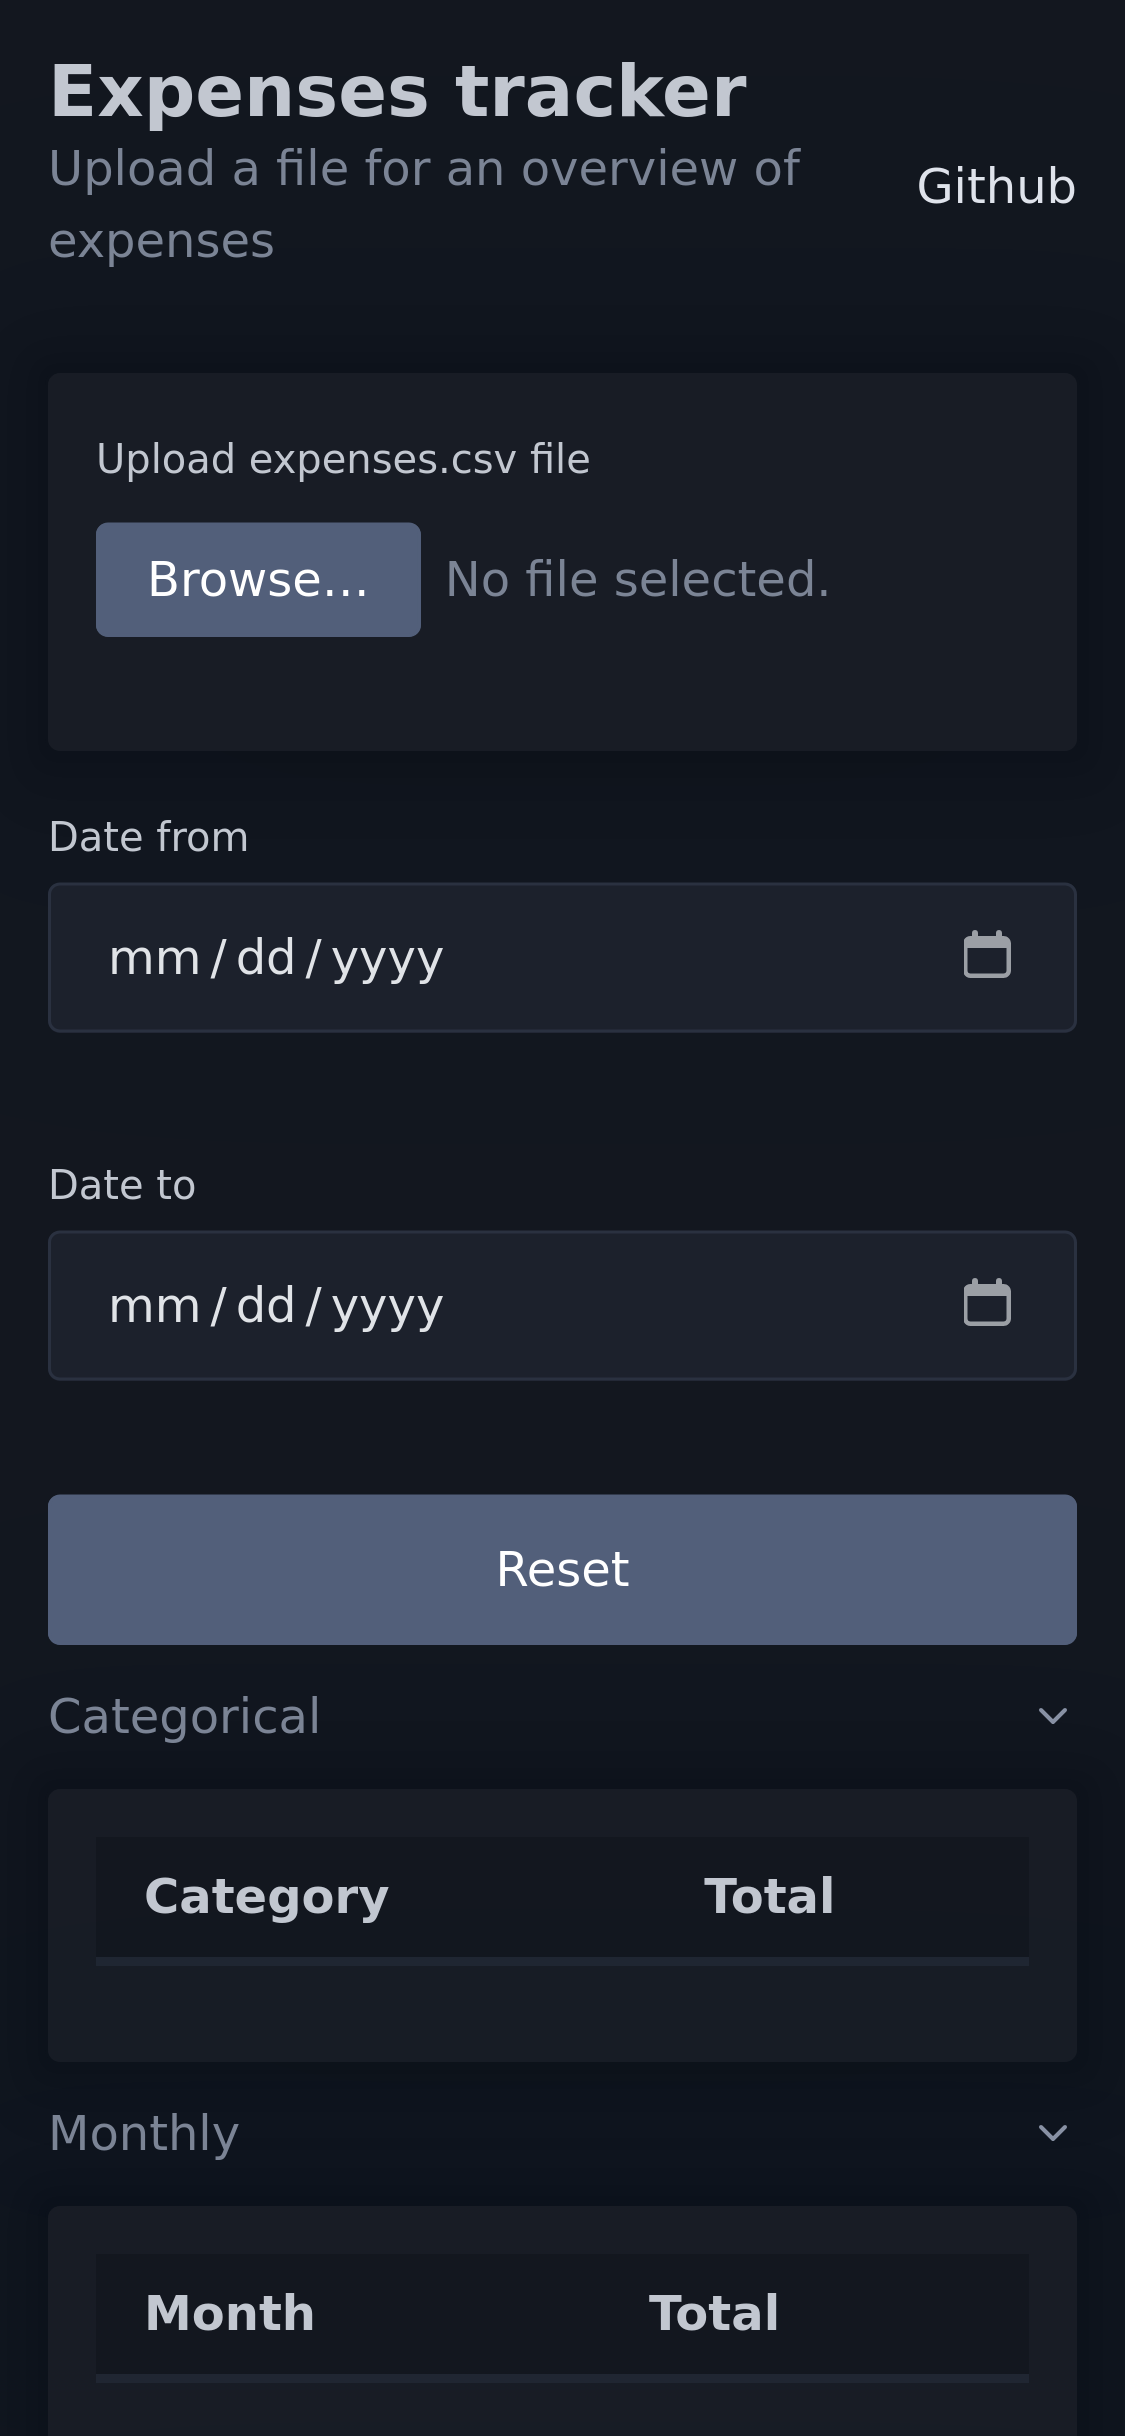
A simple, no build dashboard using Vue and PicoCSS #
After a month of doing this, I realized I need a tool to analyze my expenses. I started with a command line Python script but I later realized a webpage would allow me to analyze my expenses on any device.
Why Vue #
I’ve been using Vue with the options API at work. I think it’s really good and I wanted to explore it a more. What’s nice about it is the way logic is organized with options API. The complexity of the UI is more manageable this way. And that’s without a build step needed.
PicoCSS #
I’ve been using water.css for my small projects but after hearing too many people talk about PicoCSS, I wanted to try it.
PicoCSS is small enough, like water.css but unlike water.css, it still gives the user some control. The dashboard is really just a collection of tables that works by using the details and summary elements.
I’m curious if I’ll still be using it months or years from now, but so far, I’ve been loving this tool and I’m looking to improve it with new features.
The dashboard is available here: earlps.net/expenses-cli
The repo: github.com/elpachongco/expenses-cli